VOACAP: Understanding and Using the Voice of America Coverage Analysis Program

VOACAP:Understanding and Using theVoice of America Coverage Analysis Program
by Rob Wagner VK3BVW
My thanks to Jari Perkiömäki, OH6BG, for his assistance in preparing this article. It first appeared in the April 2026 issue of my World of Shortwave Listening column for The Spectrum Monitor magazine. Further details on this excellent publication are available at www.thespectrummonitor.com
When you have spent time on the HF bands chasing DX or tuning across the shortwave spectrum, you will know that propagation can feel unpredictable. Signals that are strong one day may vanish the next, and paths that seem impossible can suddenly open without warning.
VOACAP, the Voice of America Coverage Analysis Program, helps make sense of this constantly shifting landscape. Originally developed by engineers at the Voice of America, VOACAP began as a professional planning tool for international broadcasting and has since become one of the most widely used propagation prediction systems among radio amateurs and shortwave listeners alike.
VOACAP evolved from an earlier model, IONCAP, developed in the 1970s to estimate HF circuit performance using ionospheric theory and statistical data. VOACAP built on this foundation by incorporating improved ionospheric models and refinements based on real-world measurements. Although its roots lie in government and broadcast engineering, the program has long been available to the public and is now accessible via a convenient web interface. This has made sophisticated propagation modelling available to anyone with an internet connection and an interest in long-distance radio communication.
At its core, VOACAP seeks to answer a simple yet fundamental question: Will a radio signal on a given frequency travel successfully from one place to another? To do this, it models how radio waves interact with the ionosphere — the electrically charged layers of the upper atmosphere that reflect HF signals back towards Earth. By accounting for time of day, season, solar activity, and frequency, VOACAP estimates signal strength, signal-to-noise ratio, and the likelihood that a path will support communication. These predictions can be generated for specific point-to-point circuits or for broader geographic coverage areas.
Although designed for broadcast engineers, VOACAP is now widely used by amateur radio operators, shortwave listeners, emergency planners, and educators. The modern web-based interface lets users select locations, frequencies, antennas, and power levels, and then visualise expected performance on charts and maps. For many users, VOACAP provides something akin to a weather forecast for radio: not a guarantee of conditions, but a scientifically grounded guide to what is most likely to work.
What distinguishes VOACAP from simpler band-condition indicators is its grounding in physics and statistics. It incorporates models of the ionosphere, solar radiation, atmospheric noise, and path geometry to estimate how signals will behave over long distances. Rather than merely stating that conditions are “good” or “bad,” it quantifies performance in terms meaningful to operators: signal strength, likely noise levels in the receiving environment, and the circuit’s expected reliability over time. This combination of scientific rigor and practical application has helped VOACAP remain relevant long after its original broadcast role diminished.
 |
| The map view of VOACAP. The green line shows the short path between the Voice of Türkiye’s transmitter site at Emirler and a listener’s location in New York City. |
From Broadcast Tool to Online Service
VOACAP has a longer history than many users realise. For much of its life, it was a standalone Windows program maintained by the U.S. National Telecommunications and Information Administration’s Institute for Telecommunication Sciences (NTIA/ITS). During this period, it was used mainly as a professional engineering tool for planning international shortwave broadcasts rather than for amateur radio or general listening.
A major step forward came when the original Fortran source code was ported to Linux, enabling VOACAP to transition from a desktop application to an online service. Although the interface changed, the underlying prediction engine remained the same, preserving continuity with the original Windows version. Documentation from earlier versions was later incorporated into the web-based system, helping users understand what the various output parameters mean in practical terms.
As access improved, VOACAP’s audience expanded. The tool gradually gained wider use among radio amateurs and shortwave listeners, and from the outset, the online version was designed with these users in mind. Interactive maps replaced manual coordinate entry, default settings were chosen to reflect typical operating conditions, and new visual tools were added to make predictions easier to explore. While the science behind VOACAP has changed little, the way users interact with it has evolved significantly, emphasising accessibility and ease of use across a broad range of platforms.
The man behind the current iterations of VOACAP is Finnish amateur radio operator Jari Perkiömäki, OH6BG. First licensed in 1982, Jari has 333 DXCC entities confirmed and is an active contester. He is a self-taught programmer who has learned a wide range of technologies over the years, largely as a hobby. Jari’s experience includes Linux, SGML, XML, HTML, Perl, PHP, Python, JavaScript, and CSS. He first encountered the early internet during his university days and has since accumulated decades of hands-on experience.
In recent years, I have worked with Jari informally, providing user feedback and promoting VOACAP through my YouTube channel and Mount Evelyn DX Report blog. I use the online service regularly to deepen my understanding of propagation and the mysteries of the ionosphere in my ham radio and shortwave listening pursuits.

How to Use VOACAP Online
There are two versions of VOACAP available to users, depending on whether you are using it for amateur radio or shortwave listening. The interface is tailored differently for each version. You can find the amateur radio model at https://www.voacap.com/hf/ and the shortwave listener forecasting version at https://www.voacap.com/swl/.
Using VOACAP online is easier than it may first appear. The web interface centres on a world map and a set of menus that control the prediction model. Although the number of options can seem daunting, only a few are essential for generating useful results. The basic task is to define where the signal originates, where it is going, and how it will be transmitted.
The first step is to set the transmitter and receiver locations. These can be entered as latitude and longitude coordinates, selected from lists of known sites, or chosen by clicking on the map. For amateur radio use, the transmitter is typically your own station, and the receiver is the location of the station you wish to work. Shortwave listeners can reverse this arrangement by placing the transmitter at the broadcast station and the receiver at their home location. Once these points are defined, VOACAP calculates the great-circle path between them and uses that route for propagation calculations.
In both the ham and SWL versions, additional inputs include transmitter power and antenna type. Hams can choose operating modes such as SSB, CW, and FT8. The SWL interface is set to AM mode to calculate propagation for international broadcasters. Listeners can also select an antenna that best matches their listening setup. There is a setting for the broadcast reception quality you want (or are prepared to tolerate!), ranging from excellent to “bad”. There is even a setting for DRM broadcasts. These parameters need not be exact to be useful; even approximate values can reveal which bands and times are likely to be most productive.
Next, the user selects the prediction type. A point-to-point analysis is the most common choice, showing predicted performance between two specific locations over a given month. Coverage maps can also be generated to show how a signal might be received across an entire region.
Once the inputs are entered, VOACAP produces a set of tables, graphs and charts. These may show predicted signal strength, signal-to-noise ratio, and circuit reliability across frequencies and times of day. Colour-coding is typically used to highlight favourable and unfavourable conditions. In practice, this allows users to see at a glance when a particular band is likely to open or close along a given path.
With only a few minutes of setup, VOACAP can provide insights that might otherwise take years of operating experience to acquire. Whether preparing for a contest, planning a DX contact, or deciding when to listen for a distant broadcaster, the program translates the ionosphere's complex behaviour into a form that can be explored visually and interactively.
 |
| The popular propagation wheel clearly shows the best frequencies in the international shortwave bands over 24 hours in early February for the short path between Türkiye and the east coast of the USA. |
Understanding VOACAP Charts and Graphs
VOACAP’s charts can look technical at first, but they address some practical questions: How strong will the signal be? And how often will communication succeed? Once these concepts are understood, the plots become much easier to interpret.
The most common display, and perhaps the most popular, is the Propagation Wheel. This is a circular, hour-by-hour chart showing predicted propagation over a 24-hour period. Time appears along the wheel's perimeter, while frequency or band is shown inside the wheel. Colours or shading indicate readability quality, with warmer colours representing stronger success rates. These plots make it easy to see when a particular band is likely to be usable. Yellow to red on 14 MHz during daylight hours suggests a reliable daytime path, while colours on 7 MHz after sunset indicate nighttime propagation.
Another important output is the signal-to-noise ratio (SNR) plot, which compares predicted signal strength with estimated background noise. A higher SNR indicates a signal should be easier to copy, while a low SNR suggests it may be lost in noise. VOACAP models both atmospheric and man-made noise, depending on the selected environment. In the SWL model, you can select the type of noise environment at your location. The drop-down menu lets you choose from Noisy, Industrial, Residential, Rural, Quiet or Remote. This provides important input to the model, making SNR a more realistic measure of readability than signal strength alone.
 |
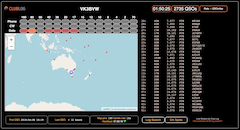
| This chart shows the Predicted Signal Power over 15 days in a month across the 4554 miles (8433 km) between Emirler and New York. |
Charts Offering Different Perspectives
VOACAP also produces reliability or circuit probability charts that express results as the percentage chance of successful communication. These values combine signal strength and noise into a single figure. A predicted reliability of 80 per cent means the circuit should work on most days under similar conditions. For many operators, this is one of the most useful outputs because it condenses complex behaviour into an easily comparable number.
The revised coverage maps in the SWL version provide a different perspective, showing how a signal from one transmitter can be received across a wide area. Colours indicate predicted signal strength or quality across locations. These maps can highlight regions of strong coverage, helping broadcasters plan services and amateurs visualise likely reception areas. Check out my video “How to Create Professional-Grade Coverage Maps with VOACAP Online” at https://youtu.be/foA2JEN0cKc.
All VOACAP outputs are statistical predictions over a given month, not real-time measurements. They represent typical conditions based on long-term data rather than current conditions. Their value lies in identifying patterns and trends rather than making precise forecasts.
Practical Tips for Hams and SWLs
VOACAP is most effective when used as a planning tool. Before turning on the radio, it is worth checking which bands and times of day are predicted to work best for the path of interest. This can save time and frustration by narrowing down the most promising options.
For amateur operators, VOACAP is particularly helpful for choosing bands for long-distance contacts. If 20 meters looks strong from a certain part of the world in the afternoon, while 40 meters appears more favourable after dark, this provides a rough operating schedule. Contest operators can use this information to anticipate when certain regions are likely to open and close. Casual operators can simply use it to decide which band to try first, rather than tuning aimlessly.
Shortwave listeners can reverse the usual logic by placing the transmitter at the broadcast site and the receiver at home. This helps predict when a station is most likely to be audible and on which frequencies. Over time, this approach builds an intuitive understanding of how frequency, distance, and time interact.
 |
| An example of a circuit reliability chart. Each international shortwave band is represented by a colour that can be toggled on or off using the legend below the chart. |
The Ability to Test Different Scenarios
Experimenting with different antennas and power levels in VOACAP can also be instructive. While the model cannot account for every detail of a real antenna installation, it can show general trends. Comparing a dipole to a directional antenna, or low power to high power, illustrates how much these factors affect long paths.
Seasonal and solar-cycle patterns are also worth exploring. Some paths favour winter conditions, while others favour summer. Higher HF bands become more reliable during periods of increased solar activity. By running predictions for different months, users can build a personalised propagation calendar for their favourite routes.
Perhaps most importantly, VOACAP should be used alongside real-world listening and operating. Comparing predictions with actual results builds understanding and reveals how local noise and antenna effects influence outcomes.
Limitations and Common Misconceptions
A common misconception is that VOACAP provides a precise, real-time forecast. In fact, it assumes average, undisturbed solar and geomagnetic conditions for a given month and hour. Sudden solar flares or geomagnetic storms can dramatically alter propagation without warning. VOACAP should therefore be regarded as a guide to likely conditions rather than a guarantee of reception.
Another limitation concerns antenna and environmental modelling. Real installations are affected by terrain, buildings, and local noise sources that VOACAP cannot fully represent. Two stations with similar antennas may experience very different results depending on their surroundings.
There is also a tendency to focus on a single output, such as signal strength, while ignoring noise or the development of MUF (median maximum usable frequency). A strong signal does not guarantee readability if the noise level is high. VOACAP’s combined measures, such as SNR and reliability, are more meaningful but remain simplified representations of complex processes.
VOACAP is often assumed to be useful only for very long-distance paths. While it excels in that role, it can also provide insight into near-vertical incidence skywave (NVIS) and medium-range propagation and seasonal changes. However, very short, line-of-sight paths are harder to model.
The key limitation is not the software itself but how it is interpreted. Used thoughtfully and in conjunction with other information sources, VOACAP becomes a powerful learning tool.
 |
| Here is a VOACAP full-colour coverage map. It shows the expected signal strength worldwide, averaged over 15 days of the month, for the Voice of Türkiye on 5960 kHz at 2300 UTC in February. |
VOACAP vs Other Propagation Tools
Propagation tools fall into two broad categories: prediction models and real-time solar weather indicators. As noted earlier, VOACAP falls into the first category. It estimates what should happen under typical conditions rather than reporting what is happening now.
Real-time tools based on solar and geomagnetic indices are excellent for reporting current conditions and detecting disturbances, but they do not translate directly into usable point-to-point predictions. VOACAP converts assumed solar conditions into specific forecasts for particular paths and frequencies.
Spotting networks, PSKReporter, WSPRNet and reverse beacon systems provide immediate evidence of what is working, but only where someone is transmitting, and someone else is listening. VOACAP predicts potential openings regardless of current activity, making it useful for advanced planning.
In practice, VOACAP works best as part of a toolkit. Real-time tools show what is happening in the solar weather now; spotting networks show what is working for others; and VOACAP suggests what should work based on long-term behaviour. Together, they provide a fuller picture than any single method.
Why It’s Important to Get to Know VOACAP
HF radio has always involved a mix of science, experience, and chance. The ionosphere is dynamic and unpredictable, and no model can capture its moment-to-moment behaviour. Yet VOACAP brings structure to this uncertainty by translating decades of research into practical predictions.
Its strength lies in combining technical depth with everyday usefulness. Newcomers can use it to determine which band might be open, while experienced operators can explore antenna options and seasonal trends. Whether used for DXing, contesting, or listening, it encourages thinking in terms of propagation paths rather than just frequencies.
In an era when much communication is invisible and automated, VOACAP preserves an element of craftsmanship in HF operation. It invites users to explore how geography, time, and solar activity shape what can be heard and worked. As long as HF radio depends on the ionosphere, there will be a need for tools that help interpret it. VOACAP does not remove the mystery and magic of propagation, but it makes that mystery more intelligible — and in doing so, it remains a valuable part of the modern radio operator’s toolkit.
References:
Lane, G., et al. VOACAP User’s Manual. Voice of America Coverage Analysis Program, 2023. https://www.voacap.com/2023/documents/VOACAP_Manual.pdf
VOACAP website: https://www.voacap.com
Signal-to-Noise Predictions Using VOACAP. A User's Guide - https://www.greg-hand.com/manuals/VOACAP%20Users%20Guide.pdf
Resources:
VOACAP For Hams : https://www.voacap.com/hf/
VOACAP For SWL: https://www.voacap.com/swl/
YouTube Videos:
Rob Wagner VK3BVW (with thanks to Jari Perkiömäki, OH6BG)


CLICK HERE for VK3BVW Live Stream (Clublog)
| QRZ callsign lookup: |
© Rob Wagner, Mount Evelyn DX Report, and contributors 2012-2026


Comments
Post a Comment
Comments are moderated and may not appear immediately. If your comment isn’t visible right away, it has been received and will be published shortly.